Checked
Winnipeg neighbourhoods: a guide to the main areas
Winnipeg, Manitoba, Canada
A guide to Winnipeg, Manitoba's 12 community areas and their best-known neighbourhoods, with 2021 Census population and housing, parks, libraries, pools, schools and transit.
Key information
The City of Winnipeg divides the city into 12 community areas, from Downtown and Point Douglas in the centre to Transcona in the east and Assiniboine South in the southwest. Fort Garry is the largest (99,710 people in 2021), Downtown is the densest, and Transcona grew fastest. Each area below lists its neighbourhoods, housing, parks, libraries, school divisions and transit routes.
On this page
How Winnipeg is divided
The City of Winnipeg groups its neighbourhoods into 12 community areas for census profiles: Downtown, Point Douglas, Inkster, Seven Oaks, River East, Transcona, St. Boniface, St. Vital, River Heights, Fort Garry, Assiniboine South and St. James - Assiniboia. Each community area is split into neighbourhood clusters and then neighbourhoods.
Community areas are not the same as the 15 council wards, which are used for elections. Some wards cross community area lines. The City parks inventory and census profiles use the community area and neighbourhood names in this guide.
Winnipeg had 749,607 people in the 2021 Census. Community area figures count the non-institutional population only (736,660 in total), so they add up to less than the city total.
Sources: 2021 Census neighbourhood profiles | City of Winnipeg · 2021 Census community area profiles | City of Winnipeg · Winnipeg Open Data: Parks and Open Space
Winnipeg community areas compared
| Community area | 2021 population | Change since 2016 | Land area (km²) | People per km² | Single-detached homes | Apartments 5+ storeys | Owner households | Median household income |
|---|---|---|---|---|---|---|---|---|
| DowntownMap of Downtown | 68,445 | +2.4% | 16.3 | 4,193 | 33% | 34% | 34% | $53,600 |
| Point DouglasMap of Point Douglas | 41,275 | +1.2% | 10.9 | 3,796 | 64% | 6% | 57% | $62,800 |
| InksterMap of Inkster | 36,160 | +13.0% | 18.1 | 1,998 | 72% | 1% | 73% | $88,000 |
| Seven OaksMap of Seven Oaks | 74,240 | +8.6% | 39.9 | 1,862 | 64% | 6% | 72% | $90,000 |
| River EastMap of River East | 87,890 | +3.9% | 34.7 | 2,534 | 60% | 14% | 62% | $75,000 |
| TransconaMap of Transcona | 43,025 | +18.6% | 28.8 | 1,495 | 70% | 2% | 81% | $92,000 |
| St. BonifaceMap of St. Boniface | 63,775 | +9.0% | 47.7 | 1,338 | 63% | 7% | 68% | $93,000 |
| St. VitalMap of St. Vital | 69,640 | +3.0% | 63.3 | 1,101 | 61% | 12% | 69% | $84,000 |
| River HeightsMap of River Heights | 57,565 | +0.3% | 18.1 | 3,180 | 46% | 25% | 54% | $76,000 |
| Fort GarryMap of Fort Garry | 99,710 | +16.2% | 77.0 | 1,294 | 57% | 13% | 66% | $88,000 |
| Assiniboine SouthMap of Assiniboine South | 35,750 | +7.0% | 61.2 | 584 | 63% | 9% | 77% | $102,000 |
| St. James - AssiniboiaMap of St. James - Assiniboia | 59,190 | +1.2% | 59.3 | 999 | 61% | 14% | 66% | $80,000 |
This table uses the City of Winnipeg 2021 Census community area profiles. Single-detached and apartment shares are percentages of occupied private homes. Change since 2016 is calculated from the two census counts.
Sources: 2021 Census community area profiles | City of Winnipeg · Downtown Community Area 2021 Census profile (spreadsheet) | City of Winnipeg · Fort Garry Community Area 2021 Census profile (spreadsheet) | City of Winnipeg · Transcona Community Area 2021 Census profile (spreadsheet) | City of Winnipeg
Which parts of Winnipeg have the most people?
- Fort Garry99,710 people
- River East87,890 people
- Seven Oaks74,240 people
- St. Vital69,640 people
- Downtown68,445 people
- St. Boniface63,775 people
- St. James - Assiniboia59,190 people
- River Heights57,565 people
- Transcona43,025 people
- Point Douglas41,275 people
- Inkster36,160 people
- Assiniboine South35,750 people
Fort Garry and River East are the largest community areas by population. Transcona grew fastest between 2016 and 2021 (up 18.6%), followed by Fort Garry (up 16.2%). In Transcona, 16% of homes standing in 2021 were built from 2016 to 2021, the highest share in the city. Downtown is the most densely populated, with about 4,193 people per square kilometre.
Sources: 2021 Census community area profiles | City of Winnipeg
The 12 community areas
Each area below lists its best-known neighbourhoods, housing and census facts, and nearby City services: library branches, indoor pools, spray pads, off-leash dog areas, toboggan sites, school divisions and transit routes. Service counts only include sites inside the area, so a library just across a boundary may still be the closest one.
Downtown community area
Downtown community area, Winnipeg, Manitoba
Downtown is one of the 12 community areas the City of Winnipeg uses for census profiles. It covers the centre of Winnipeg, from the Exchange District and The Forks west through Wolseley to Polo Park. Neighbourhoods in it include Exchange District, China Town, The Forks, Broadway-Assiniboine, Centennial, West Broadway, Spence, Wolseley, Armstrong Point, Daniel McIntyre, Sargent Park and Polo Park.
In the 2021 Census it had 68,445 residents (up 2.4% from 2016) on 16.3 square kilometres, or about 4,193 people per square kilometre. 33% of homes are single-detached houses, 34% are apartments in buildings of five or more storeys and 27% are apartments in smaller buildings. 34% of households own their home.
56% of homes were built in 1960 or earlier and 4% between 2016 and 2021. Median household income was $53,600, and 33% of residents were immigrants.
Large City parks here include Sargent Park (8 hectares), Omand Park (5 hectares).
- 2021 population
- 68,445
- Change since 2016
- +2.4%
- Land area
- 16.3 km²
- People per km²
- 4,193
- Single-detached homes
- 33%
- Apartments, 5+ storeys
- 34%
- Owner households
- 34%
- Median household income
- $53,600
- Council wards (park records)
- Daniel McIntyre, Point Douglas, Fort Rouge - East Fort Garry, St. James
- Library branches
- Millennium Library (251 Donald St); Cornish Library (20 West Gate); Harvey Smith Library (999 Sargent Ave)
- City indoor pools
- Kinsmen Sherbrook Pool, Cindy Klassen Recreation Complex Pool
- City spray pads
- 5
- Off-leash dog areas (park sites)
- Bonnycastle Park
- Toboggan hills and slides
- None
- Main school division (share of addresses)
- Winnipeg School Division 100%
- Lettered transit routes with stops here
- BLUE, FX2, FX3, FX4, F5, F6, F7, F8, D11 to D16, D18, D19
The map point is the average position of City park records in this community area, not a boundary or centre point.
Sources: Downtown Community Area 2021 Census profile (spreadsheet) | City of Winnipeg · 2021 Census community area profiles | City of Winnipeg · Winnipeg Open Data: Parks and Open Space · Library locations and hours | City of Winnipeg · Winnipeg Open Data: Addresses (API) · Winnipeg Transit GTFS schedule data (September 6 to December 12, 2026)
Point Douglas community area
Point Douglas community area, Winnipeg, Manitoba
Point Douglas is one of the 12 community areas the City of Winnipeg uses for census profiles. It covers the area just north of downtown. Neighbourhoods in it include North Point Douglas, South Point Douglas, William Whyte, Lord Selkirk Park, Dufferin, St. John's, Luxton, Robertson and Burrows Central.
In the 2021 Census it had 41,275 residents (up 1.2% from 2016) on 10.9 square kilometres, or about 3,796 people per square kilometre. 64% of homes are single-detached houses, 6% are apartments in buildings of five or more storeys and 15% are apartments in smaller buildings. 57% of households own their home.
69% of homes were built in 1960 or earlier and 3% between 2016 and 2021. Median household income was $62,800, and 32% of residents were immigrants.
Large City parks here include Old Exhibition Athletic Grounds (14 hectares), St. John's Park (6 hectares).
- 2021 population
- 41,275
- Change since 2016
- +1.2%
- Land area
- 10.9 km²
- People per km²
- 3,796
- Single-detached homes
- 64%
- Apartments, 5+ storeys
- 6%
- Owner households
- 57%
- Median household income
- $62,800
- Council wards (park records)
- Mynarski, Point Douglas
- Library branches
- St. John's Library (500 Salter St)
- City indoor pools
- Sergeant Tommy Prince Place Pool
- City spray pads
- 4
- Off-leash dog areas (park sites)
- None
- Toboggan hills and slides
- None
- Main school division (share of addresses)
- Winnipeg School Division 100%
- Lettered transit routes with stops here
- FX2, FX3, F5, F6, F8, D11, D17
The map point is the average position of City park records in this community area, not a boundary or centre point.
Sources: Point Douglas Community Area 2021 Census profile (spreadsheet) | City of Winnipeg · 2021 Census community area profiles | City of Winnipeg · Winnipeg Open Data: Parks and Open Space · Library locations and hours | City of Winnipeg · Winnipeg Open Data: Addresses (API) · Winnipeg Transit GTFS schedule data (September 6 to December 12, 2026)
Inkster community area
Inkster community area, Winnipeg, Manitoba
Inkster is one of the 12 community areas the City of Winnipeg uses for census profiles. It covers the northwest of the city. Neighbourhoods in it include Tyndall Park, Weston, Brooklands, Burrows-Keewatin, Shaughnessy Park, Inkster Gardens and Oak Point Highway.
In the 2021 Census it had 36,160 residents (up 13.0% from 2016) on 18.1 square kilometres, or about 1,998 people per square kilometre. 72% of homes are single-detached houses, 1% are apartments in buildings of five or more storeys and 12% are apartments in smaller buildings. 73% of households own their home.
27% of homes were built in 1960 or earlier and 10% between 2016 and 2021. Median household income was $88,000, and 48% of residents were immigrants.
Large City parks here include Woodsworth Park (25 hectares), Tyndall Park C.C (10 hectares).
- 2021 population
- 36,160
- Change since 2016
- +13.0%
- Land area
- 18.1 km²
- People per km²
- 1,998
- Single-detached homes
- 72%
- Apartments, 5+ storeys
- 1%
- Owner households
- 73%
- Median household income
- $88,000
- Council wards (park records)
- Point Douglas, Old Kildonan
- Library branches
- Sir William Stephenson Library (765 Keewatin St)
- City indoor pools
- None inside the area
- City spray pads
- 1
- Off-leash dog areas (park sites)
- Woodsworth Park
- Toboggan hills and slides
- None
- Main school division (share of addresses)
- Winnipeg School Division 88%; St. James-Assiniboia School Division 12%
- Lettered transit routes with stops here
- D17, D18
The map point is the average position of City park records in this community area, not a boundary or centre point.
Sources: Inkster Community Area 2021 Census profile (spreadsheet) | City of Winnipeg · 2021 Census community area profiles | City of Winnipeg · Winnipeg Open Data: Parks and Open Space · Library locations and hours | City of Winnipeg · Winnipeg Open Data: Addresses (API) · Winnipeg Transit GTFS schedule data (September 6 to December 12, 2026)
Seven Oaks community area
Seven Oaks community area, Winnipeg, Manitoba
Seven Oaks is one of the 12 community areas the City of Winnipeg uses for census profiles. It covers the north end of the city. Neighbourhoods in it include The Maples, Garden City, Amber Trails, Riverbend, Rivergrove, Jefferson, Margaret Park, Kildonan Park, Templeton-Sinclair and Mandalay West.
In the 2021 Census it had 74,240 residents (up 8.6% from 2016) on 39.9 square kilometres, or about 1,862 people per square kilometre. 64% of homes are single-detached houses, 6% are apartments in buildings of five or more storeys and 19% are apartments in smaller buildings. 72% of households own their home.
20% of homes were built in 1960 or earlier and 8% between 2016 and 2021. Median household income was $90,000, and 42% of residents were immigrants.
Large City parks here include Kildonan Park (40 hectares), Beryl Watts Park / Vince Leah C.C (13 hectares).
- 2021 population
- 74,240
- Change since 2016
- +8.6%
- Land area
- 39.9 km²
- People per km²
- 1,862
- Single-detached homes
- 64%
- Apartments, 5+ storeys
- 6%
- Owner households
- 72%
- Median household income
- $90,000
- Council wards (park records)
- Old Kildonan, Mynarski, North Kildonan
- Library branches
- West Kildonan Library (365 Jefferson Ave)
- City indoor pools
- Seven Oaks Pool
- City spray pads
- 2
- Off-leash dog areas (park sites)
- None
- Toboggan hills and slides
- Kildonan Park slides
- Main school division (share of addresses)
- Seven Oaks School Division 96%; Winnipeg School Division 4%
- Lettered transit routes with stops here
- FX2, F5, F6, D10, D11
The map point is the average position of City park records in this community area, not a boundary or centre point.
Sources: Seven Oaks Community Area 2021 Census profile (spreadsheet) | City of Winnipeg · 2021 Census community area profiles | City of Winnipeg · Winnipeg Open Data: Parks and Open Space · Library locations and hours | City of Winnipeg · Winnipeg Open Data: Addresses (API) · Winnipeg Transit GTFS schedule data (September 6 to December 12, 2026)
River East community area
River East community area, Winnipeg, Manitoba
River East is one of the 12 community areas the City of Winnipeg uses for census profiles. It covers the northeast of the city. Neighbourhoods in it include East Elmwood, Chalmers, Valley Gardens, Munroe East, Munroe West, Rossmere-A, River East, Springfield North, Kil-Cona Park, Talbot-Grey and Valhalla.
In the 2021 Census it had 87,890 residents (up 3.9% from 2016) on 34.7 square kilometres, or about 2,534 people per square kilometre. 60% of homes are single-detached houses, 14% are apartments in buildings of five or more storeys and 16% are apartments in smaller buildings. 62% of households own their home.
33% of homes were built in 1960 or earlier and 4% between 2016 and 2021. Median household income was $75,000, and 23% of residents were immigrants.
Large City parks here include Kilcona Park (148 hectares), Civic Park (17 hectares), Bunn's Creek Centennial Park (17 hectares).
- 2021 population
- 87,890
- Change since 2016
- +3.9%
- Land area
- 34.7 km²
- People per km²
- 2,534
- Single-detached homes
- 60%
- Apartments, 5+ storeys
- 14%
- Owner households
- 62%
- Median household income
- $75,000
- Council wards (park records)
- North Kildonan, Elmwood - East Kildonan, Transcona
- Library branches
- Henderson Library (1-1050 Henderson Hwy); Munroe Library (489 London St)
- City indoor pools
- Elmwood Kildonans Pool
- City spray pads
- 4
- Off-leash dog areas (park sites)
- Kilcona Park
- Toboggan hills and slides
- Civic Park hill, Harbourview Recreation Complex hill, Bunn's Creek Park slide, Fraser's Grove Park slide
- Main school division (share of addresses)
- River East Transcona School Division 80%; Winnipeg School Division 20%
- Lettered transit routes with stops here
- FX3, FX4, F8, D10, D17
The map point is the average position of City park records in this community area, not a boundary or centre point.
Sources: River East Community Area 2021 Census profile (spreadsheet) | City of Winnipeg · 2021 Census community area profiles | City of Winnipeg · Winnipeg Open Data: Parks and Open Space · Library locations and hours | City of Winnipeg · Winnipeg Open Data: Addresses (API) · Winnipeg Transit GTFS schedule data (September 6 to December 12, 2026)
Transcona community area
Transcona community area, Winnipeg, Manitoba
Transcona is one of the 12 community areas the City of Winnipeg uses for census profiles. It covers the far east of the city. Neighbourhoods in it include Kildare-Redonda, Regent, Radisson, Peguis, Canterbury Park, Mission Gardens, Transcona South, Meadows, Melrose and Victoria West.
In the 2021 Census it had 43,025 residents (up 18.6% from 2016) on 28.8 square kilometres, or about 1,495 people per square kilometre. 70% of homes are single-detached houses, 2% are apartments in buildings of five or more storeys and 14% are apartments in smaller buildings. 81% of households own their home.
18% of homes were built in 1960 or earlier and 16% between 2016 and 2021. Median household income was $92,000, and 22% of residents were immigrants.
Large City parks here include Buhler Recreation Park (57 hectares), Victoria Jason Park (9 hectares).
- 2021 population
- 43,025
- Change since 2016
- +18.6%
- Land area
- 28.8 km²
- People per km²
- 1,495
- Single-detached homes
- 70%
- Apartments, 5+ storeys
- 2%
- Owner households
- 81%
- Median household income
- $92,000
- Council wards (park records)
- Transcona
- Library branches
- Transcona Library (1 Transcona Boulevard)
- City indoor pools
- Transcona Kinsmen Centennial Pool
- City spray pads
- 1
- Off-leash dog areas (park sites)
- Devonshire Village Dog Park, Transcona off-leash dog area
- Toboggan hills and slides
- Victoria Jason Park hill
- Main school division (share of addresses)
- River East Transcona School Division 99%
- Lettered transit routes with stops here
- FX3, D14, D17
The map point is the average position of City park records in this community area, not a boundary or centre point.
Sources: Transcona Community Area 2021 Census profile (spreadsheet) | City of Winnipeg · 2021 Census community area profiles | City of Winnipeg · Winnipeg Open Data: Parks and Open Space · Library locations and hours | City of Winnipeg · Winnipeg Open Data: Addresses (API) · Winnipeg Transit GTFS schedule data (September 6 to December 12, 2026)
St. Boniface community area
St. Boniface community area, Winnipeg, Manitoba
St. Boniface is one of the 12 community areas the City of Winnipeg uses for census profiles. It covers the southeast of the city. Neighbourhoods in it include North St. Boniface, Central St. Boniface, Norwood West, Norwood East, Windsor Park, Southdale, Island Lakes, Royalwood, Sage Creek and Niakwa Park.
In the 2021 Census it had 63,775 residents (up 9.0% from 2016) on 47.7 square kilometres, or about 1,338 people per square kilometre. 63% of homes are single-detached houses, 7% are apartments in buildings of five or more storeys and 19% are apartments in smaller buildings. 68% of households own their home.
27% of homes were built in 1960 or earlier and 9% between 2016 and 2021. Median household income was $93,000, and 19% of residents were immigrants.
Large City parks here include Bois-des-esprits (31 hectares), Whittier Park (21 hectares), Mazenod Park (13 hectares).
- 2021 population
- 63,775
- Change since 2016
- +9.0%
- Land area
- 47.7 km²
- People per km²
- 1,338
- Single-detached homes
- 63%
- Apartments, 5+ storeys
- 7%
- Owner households
- 68%
- Median household income
- $93,000
- Council wards (park records)
- St. Boniface, St. Vital, Transcona
- Library branches
- St. Boniface Library (100-131 Provencher Blvd); Windsor Park Library (1195 Archibald St)
- City indoor pools
- Piscine Dan Vandal Bonivital Pool
- City spray pads
- 3
- Off-leash dog areas (park sites)
- Mazenod Park
- Toboggan hills and slides
- None
- Main school division (share of addresses)
- Louis Riel School Division 100%
- Lettered transit routes with stops here
- FX2, FX4, F7, F9, D14, D15, D16
The map point is the average position of City park records in this community area, not a boundary or centre point.
Sources: St. Boniface Community Area 2021 Census profile (spreadsheet) | City of Winnipeg · 2021 Census community area profiles | City of Winnipeg · Winnipeg Open Data: Parks and Open Space · Library locations and hours | City of Winnipeg · Winnipeg Open Data: Addresses (API) · Winnipeg Transit GTFS schedule data (September 6 to December 12, 2026)
St. Vital community area
St. Vital community area, Winnipeg, Manitoba
St. Vital is one of the 12 community areas the City of Winnipeg uses for census profiles. It covers the south of the city. Neighbourhoods in it include Norberry, Glenwood, Elm Park, Pulberry, River Park South, Maple Grove Park, Dakota Crossing, Worthington, Meadowood and Vista.
In the 2021 Census it had 69,640 residents (up 3.0% from 2016) on 63.3 square kilometres, or about 1,101 people per square kilometre. 61% of homes are single-detached houses, 12% are apartments in buildings of five or more storeys and 18% are apartments in smaller buildings. 69% of households own their home.
19% of homes were built in 1960 or earlier and 4% between 2016 and 2021. Median household income was $84,000, and 22% of residents were immigrants.
Large City parks here include Maple Grove Park (65 hectares), St. Vital Park (48 hectares).
- 2021 population
- 69,640
- Change since 2016
- +3.0%
- Land area
- 63.3 km²
- People per km²
- 1,101
- Single-detached homes
- 61%
- Apartments, 5+ storeys
- 12%
- Owner households
- 69%
- Median household income
- $84,000
- Council wards (park records)
- St. Vital, St. Norbert - Seine River
- Library branches
- Louis Riel Library (1168 Dakota St); St. Vital Library (6 Fermor Ave)
- City indoor pools
- None inside the area
- City spray pads
- 0
- Off-leash dog areas (park sites)
- Maple Grove Park
- Toboggan hills and slides
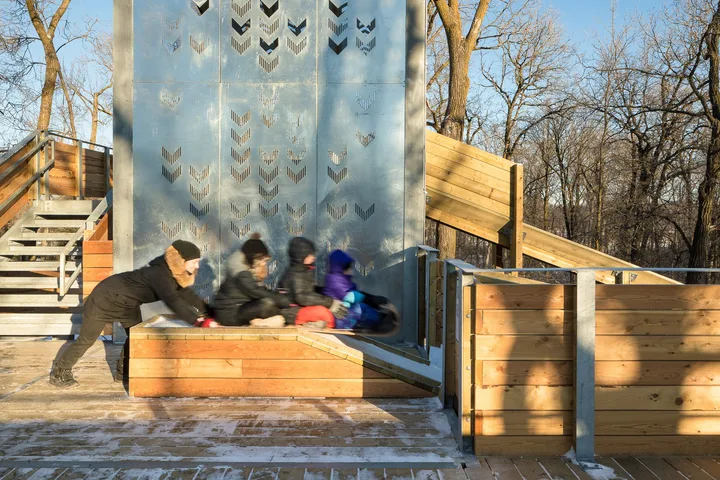
- St. Vital Park slides
- Main school division (share of addresses)
- Louis Riel School Division 100%
- Lettered transit routes with stops here
- BLUE, FX2, F6, F7, F9
The map point is the average position of City park records in this community area, not a boundary or centre point.
Sources: St. Vital Community Area 2021 Census profile (spreadsheet) | City of Winnipeg · 2021 Census community area profiles | City of Winnipeg · Winnipeg Open Data: Parks and Open Space · Library locations and hours | City of Winnipeg · Winnipeg Open Data: Addresses (API) · Winnipeg Transit GTFS schedule data (September 6 to December 12, 2026)
River Heights community area
River Heights community area, Winnipeg, Manitoba
River Heights is one of the 12 community areas the City of Winnipeg uses for census profiles. It covers the area just southwest of downtown. Neighbourhoods in it include Crescentwood, Wellington Crescent, North River Heights, Central River Heights, South River Heights, Grant Park, Riverview, Lord Roberts, River-Osborne, Earl Grey and Rockwood.
In the 2021 Census it had 57,565 residents (up 0.3% from 2016) on 18.1 square kilometres, or about 3,180 people per square kilometre. 46% of homes are single-detached houses, 25% are apartments in buildings of five or more storeys and 23% are apartments in smaller buildings. 54% of households own their home.
55% of homes were built in 1960 or earlier and 3% between 2016 and 2021. Median household income was $76,000, and 17% of residents were immigrants.
Large City parks here include Churchill Drive Park (21 hectares), Grant Park Athletic Grounds (9 hectares).
- 2021 population
- 57,565
- Change since 2016
- +0.3%
- Land area
- 18.1 km²
- People per km²
- 3,180
- Single-detached homes
- 46%
- Apartments, 5+ storeys
- 25%
- Owner households
- 54%
- Median household income
- $76,000
- Council wards (park records)
- Fort Rouge - East Fort Garry, River Heights - Fort Garry
- Library branches
- Bill and Helen Norrie Library (15 Poseidon Bay); Osborne Library (625 Osborne St)
- City indoor pools
- Pan Am Pool
- City spray pads
- 3
- Off-leash dog areas (park sites)
- None
- Toboggan hills and slides
- None
- Main school division (share of addresses)
- Winnipeg School Division 100%
- Lettered transit routes with stops here
- BLUE, FX3, F5, F6, F8, D11, D16, D19
The map point is the average position of City park records in this community area, not a boundary or centre point.
Sources: River Heights Community Area 2021 Census profile (spreadsheet) | City of Winnipeg · 2021 Census community area profiles | City of Winnipeg · Winnipeg Open Data: Parks and Open Space · Library locations and hours | City of Winnipeg · Winnipeg Open Data: Addresses (API) · Winnipeg Transit GTFS schedule data (September 6 to December 12, 2026)
Fort Garry community area
Fort Garry community area, Winnipeg, Manitoba
Fort Garry is one of the 12 community areas the City of Winnipeg uses for census profiles. It covers the south of the city. Neighbourhoods in it include Fort Richmond, Crescent Park, Linden Woods, Whyte Ridge, Waverley Heights, Bridgwater Forest, Bridgwater Lakes, St. Norbert, Richmond West, Wildwood and South Pointe.
In the 2021 Census it had 99,710 residents (up 16.2% from 2016) on 77.0 square kilometres, or about 1,294 people per square kilometre. 57% of homes are single-detached houses, 13% are apartments in buildings of five or more storeys and 19% are apartments in smaller buildings. 66% of households own their home.
10% of homes were built in 1960 or earlier and 14% between 2016 and 2021. Median household income was $88,000, and 34% of residents were immigrants.
Large City parks here include King's Park (42 hectares), Trappiste Monastery Forest (36 hectares), Crescent Drive Park (26 hectares).
- 2021 population
- 99,710
- Change since 2016
- +16.2%
- Land area
- 77.0 km²
- People per km²
- 1,294
- Single-detached homes
- 57%
- Apartments, 5+ storeys
- 13%
- Owner households
- 66%
- Median household income
- $88,000
- Council wards (park records)
- Waverley West, St. Norbert - Seine River, River Heights - Fort Garry, Fort Rouge - East Fort Garry
- Library branches
- Fort Garry Library (1360 Pembina Hwy); Pembina Trail Library (2724 Pembina Hwy)
- City indoor pools
- Margaret Grant Pool
- City spray pads
- 4
- Off-leash dog areas (park sites)
- Brenda Leipsic Park, Kings Park, Whyte Ridge
- Toboggan hills and slides
- Crescent Drive Park slide, King's Park slide
- Main school division (share of addresses)
- Pembina Trails School Division 93%; Seine River School Division 6%
- Lettered transit routes with stops here
- BLUE, F8, F9, D11
The map point is the average position of City park records in this community area, not a boundary or centre point.
Sources: Fort Garry Community Area 2021 Census profile (spreadsheet) | City of Winnipeg · 2021 Census community area profiles | City of Winnipeg · Winnipeg Open Data: Parks and Open Space · Library locations and hours | City of Winnipeg · Winnipeg Open Data: Addresses (API) · Winnipeg Transit GTFS schedule data (September 6 to December 12, 2026)
Assiniboine South community area
Assiniboine South community area, Winnipeg, Manitoba
Assiniboine South is one of the 12 community areas the City of Winnipeg uses for census profiles. It covers the southwest of the city. Neighbourhoods in it include Tuxedo, Old Tuxedo, South Tuxedo, Roblin Park, Westdale, Varsity View, Ridgewood South, Marlton and Elmhurst.
In the 2021 Census it had 35,750 residents (up 7.0% from 2016) on 61.2 square kilometres, or about 584 people per square kilometre. 63% of homes are single-detached houses, 9% are apartments in buildings of five or more storeys and 17% are apartments in smaller buildings. 77% of households own their home.
10% of homes were built in 1960 or earlier and 11% between 2016 and 2021. Median household income was $102,000, and 15% of residents were immigrants.
Large City parks here include Assiniboine Forest (292 hectares), Assiniboine Park (163 hectares).
- 2021 population
- 35,750
- Change since 2016
- +7.0%
- Land area
- 61.2 km²
- People per km²
- 584
- Single-detached homes
- 63%
- Apartments, 5+ storeys
- 9%
- Owner households
- 77%
- Median household income
- $102,000
- Council wards (park records)
- Charleswood - Tuxedo - Westwood
- Library branches
- Charleswood Library (6-4910 Roblin Blvd)
- City indoor pools
- None inside the area
- City spray pads
- 1
- Off-leash dog areas (park sites)
- Charleswood Off-Leash Dog Area
- Toboggan hills and slides
- None
- Main school division (share of addresses)
- Pembina Trails School Division 97%; Winnipeg School Division 3%
- Lettered transit routes with stops here
- FX3, D19
The map point is the average position of City park records in this community area, not a boundary or centre point.
Sources: Assiniboine South Community Area 2021 Census profile (spreadsheet) | City of Winnipeg · 2021 Census community area profiles | City of Winnipeg · Winnipeg Open Data: Parks and Open Space · Library locations and hours | City of Winnipeg · Winnipeg Open Data: Addresses (API) · Winnipeg Transit GTFS schedule data (September 6 to December 12, 2026)
St. James - Assiniboia community area
St. James - Assiniboia community area, Winnipeg, Manitoba
St. James - Assiniboia is one of the 12 community areas the City of Winnipeg uses for census profiles. It covers the west of the city. Neighbourhoods in it include Deer Lodge, Bruce Park, Silver Heights, Sturgeon Creek, Westwood, Crestview, Heritage Park, Kirkfield, Woodhaven and Booth.
In the 2021 Census it had 59,190 residents (up 1.2% from 2016) on 59.3 square kilometres, or about 999 people per square kilometre. 61% of homes are single-detached houses, 14% are apartments in buildings of five or more storeys and 17% are apartments in smaller buildings. 66% of households own their home.
32% of homes were built in 1960 or earlier and 2% between 2016 and 2021. Median household income was $80,000, and 16% of residents were immigrants.
Large City parks here include Living Prairie Museum (18 hectares), Optimist Park (18 hectares), Sturgeon Creek Parkway-C (18 hectares).
- 2021 population
- 59,190
- Change since 2016
- +1.2%
- Land area
- 59.3 km²
- People per km²
- 999
- Single-detached homes
- 61%
- Apartments, 5+ storeys
- 14%
- Owner households
- 66%
- Median household income
- $80,000
- Council wards (park records)
- St. James, Charleswood - Tuxedo - Westwood
- Library branches
- St. James-Assiniboia Library (1910 Portage Ave); Westwood Library (66 Allard Ave)
- City indoor pools
- St. James Civic Centre Pool, St. James Assiniboia Centennial Pool
- City spray pads
- 2
- Off-leash dog areas (park sites)
- Bourkevale Park, Sturgeon Rd and Silver Ave dog park, Westview Park
- Toboggan hills and slides
- Westview Park hill
- Main school division (share of addresses)
- St. James-Assiniboia School Division 99%
- Lettered transit routes with stops here
- BLUE, FX3, D12, D13, D15
The map point is the average position of City park records in this community area, not a boundary or centre point.
Sources: St. James - Assiniboia Community Area 2021 Census profile (spreadsheet) | City of Winnipeg · 2021 Census community area profiles | City of Winnipeg · Winnipeg Open Data: Parks and Open Space · Library locations and hours | City of Winnipeg · Winnipeg Open Data: Addresses (API) · Winnipeg Transit GTFS schedule data (September 6 to December 12, 2026)
Sources: 2021 Census community area profiles | City of Winnipeg · Winnipeg Open Data: Parks and Open Space · Library locations and hours | City of Winnipeg · Winnipeg Open Data: Swimming Pool Indoor (API) · Winnipeg Open Data: Swimming Pool Spray Pad (API) · Off-leash dog area locations | City of Winnipeg · Toboggan hills and winter slides in Winnipeg parks | City of Winnipeg
Which school division serves each area?
| Community area | School divisions (share of addresses) |
|---|---|
| Downtown | Winnipeg School Division (100%) |
| Point Douglas | Winnipeg School Division (100%) |
| Inkster | Winnipeg School Division (88%); St. James-Assiniboia School Division (12%) |
| Seven Oaks | Seven Oaks School Division (96%); Winnipeg School Division (4%) |
| River East | River East Transcona School Division (80%); Winnipeg School Division (20%) |
| Transcona | River East Transcona School Division (99%) |
| St. Boniface | Louis Riel School Division (100%) |
| St. Vital | Louis Riel School Division (100%) |
| River Heights | Winnipeg School Division (100%) |
| Fort Garry | Pembina Trails School Division (93%); Seine River School Division (6%) |
| Assiniboine South | Pembina Trails School Division (97%); Winnipeg School Division (3%) |
| St. James - Assiniboia | St. James-Assiniboia School Division (99%) |
Most of Winnipeg is served by six school divisions, and each community area falls mostly in one of them. The shares below are worked out from the City address list, which records a school division for each address. Always confirm the school for your exact address with the division before you register.
Sources: Winnipeg Open Data: Addresses (API) · Winnipeg Open Data: Parks and Open Space
Getting around: the transit network
| Route class | Peak | Off-peak | Nights and weekends |
|---|---|---|---|
| Rapid Transit | 4 to 10 min | 5 to 10 min | 10 to 30 min |
| Frequent Express | 5 to 15 min | 10 to 15 min | 10 to 30 min |
| Frequent | 10 to 15 min | 10 to 15 min | 10 to 30 min |
| Direct | 10 to 15 min | 10 to 20 min | 15 to 30 min |
| Connector | 15 to 30 min | 15 to 30 min | 20 to 60 min |
| Community | 30 to 60 min | 30 to 60 min | 30 to 60 min |
| On-Request | About 5 to 20 min after booking | Varies | Varies |
Winnipeg Transit runs a spine-and-feeder network. Main lines run often on major roads, and community, connector and On-Request routes feed into them. The lettered routes in each area listing come from the Winnipeg Transit schedule data for fall 2026 and show routes with at least five stops in that area.
Sources: Understanding the transit network | City of Winnipeg · Winnipeg Transit GTFS schedule data (September 6 to December 12, 2026) · Routes | Winnipeg Transit
Questions about Winnipeg neighbourhoods
How many community areas does Winnipeg have?
The City of Winnipeg uses 12 community areas for its census profiles, from Downtown to Transcona. Each is divided into neighbourhood clusters and neighbourhoods.
Source: 2021 Census community area profiles | City of Winnipeg
What was the population of Winnipeg in the 2021 Census?
Winnipeg had 749,607 people in 2021, up 6.3% from 705,244 in 2016, according to the City census profiles.
Source: Downtown Community Area 2021 Census profile (spreadsheet) | City of Winnipeg
Which part of Winnipeg is growing fastest?
Transcona grew 18.6% between 2016 and 2021, from 36,280 to 43,025 people. Fort Garry grew 16.2%, to 99,710 people.
Source: Transcona Community Area 2021 Census profile (spreadsheet) | City of Winnipeg
Which Winnipeg community area has the most people?
Fort Garry, with 99,710 residents in 2021, followed by River East with 87,890.
Source: Fort Garry Community Area 2021 Census profile (spreadsheet) | City of Winnipeg
Where are most apartments in Winnipeg?
Downtown has the highest share of homes in buildings of five or more storeys (34%), followed by River Heights (25%).
Source: Downtown Community Area 2021 Census profile (spreadsheet) | City of Winnipeg
Which area has the highest share of homeowners?
Transcona, where 81% of households own their home. Downtown has the lowest share, at 34%.
Source: Transcona Community Area 2021 Census profile (spreadsheet) | City of Winnipeg
Which school division covers St. Vital and St. Boniface?
Louis Riel School Division. Almost all addresses in both community areas are recorded in Louis Riel in the City address list.
How many public library branches does Winnipeg have?
The Winnipeg Public Library has 20 branches, including Millennium Library downtown at 251 Donald Street.
What is the biggest park area in Winnipeg?
Assiniboine Forest (about 292 hectares) and Assiniboine Park (about 163 hectares) in Assiniboine South are the two largest City park records.
Where can I find census data for my neighbourhood?
The City publishes 2021 Census profiles for each community area, neighbourhood cluster, neighbourhood and ward as PDF and spreadsheet files.
Source: 2021 Census neighbourhood profiles | City of Winnipeg